Overview
The Home page is the landing dashboard in Resico ERP. It provides a consolidated view of upcoming reminders, key performance indicators (KPIs), one or more sales analysis reports and, when applicable, setup and licence status. Users with the appropriate rights can customise which KPI tiles are shown, filter by location, choose the period for comparison and select one or more sales analysis reports to display. The page gives a quick overview of business performance, pending tasks and outstanding system configuration steps.
Who Can Use This
- Any logged‑in user. However, KPIs and sales analysis reports are only visible if the user has been granted the Home → KPI right (to view KPIs) and/or the Home → Reports right (to view sales analysis reports). Without these rights, the user will not see KPIs or reports on the home page.
- Users assigned as remind users for CRM tasks under customers or vendors will see reminder cards.
Preconditions
- You must be logged into Resico ERP and have the necessary rights.
- To see reminders, at least one CRM entry with a reminder date must exist under a customer or vendor.
- To add a sales analysis report to the home page, you must have created a sales analysis report in the Reports → Sales Analysis section and have permission to view it.
- To display licence expiry information, the Licence module must be enabled for your tenant.
- To display the setup checklist, at least one of the core setup items (client profile, unit of measure, VAT group, product, vendor or location) must be missing.
Navigation
From anywhere in the ERP, click the Home option in the left‑hand navigation menu. This brings you to the dashboard with reminders and KPIs.
Step‑by‑Step Process
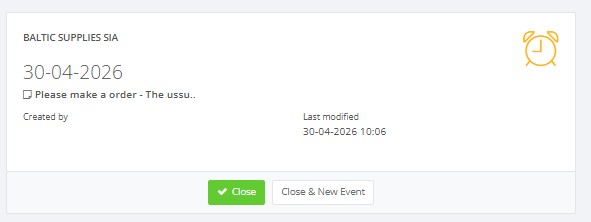
- Viewing reminders: At the top of the home page you will see cards for CRM reminders with due dates. Each card shows the customer or vendor name, due date, subject and who created/last modified the task. Use Close to mark it done or Close & New Event to mark it done and create a follow‑up task.
- Reviewing KPIs and reports:
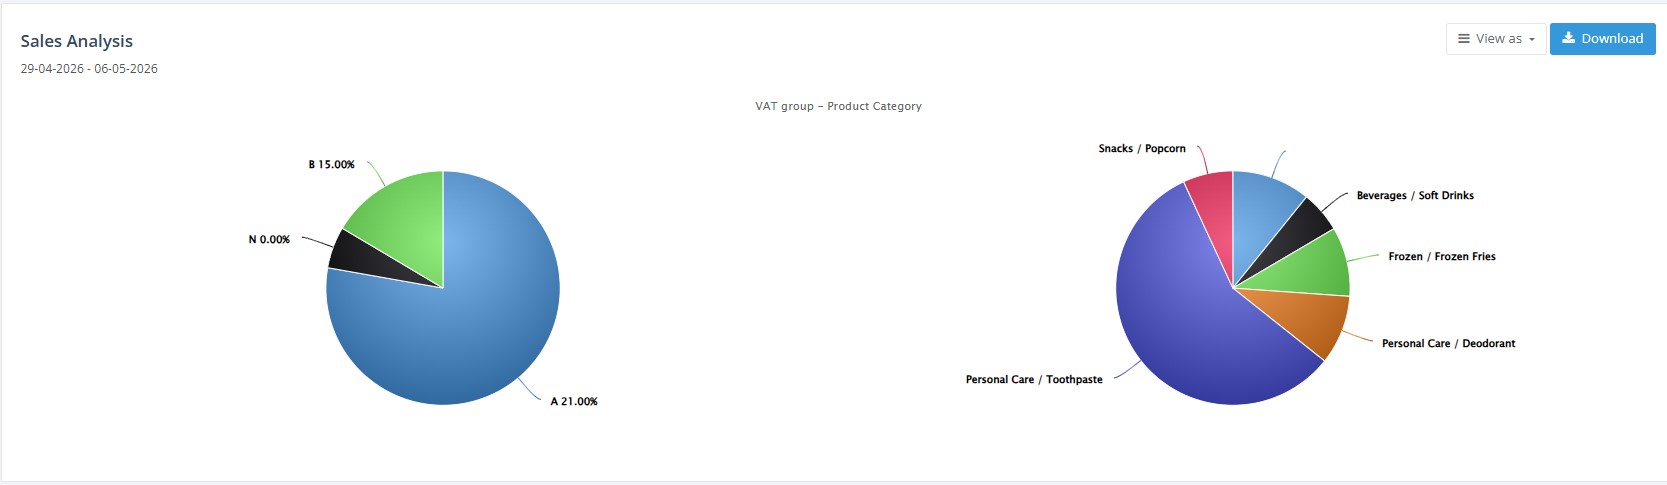
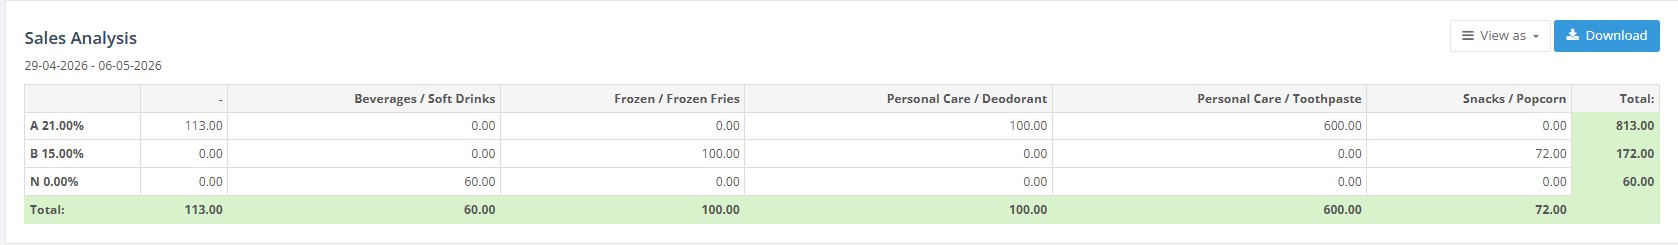
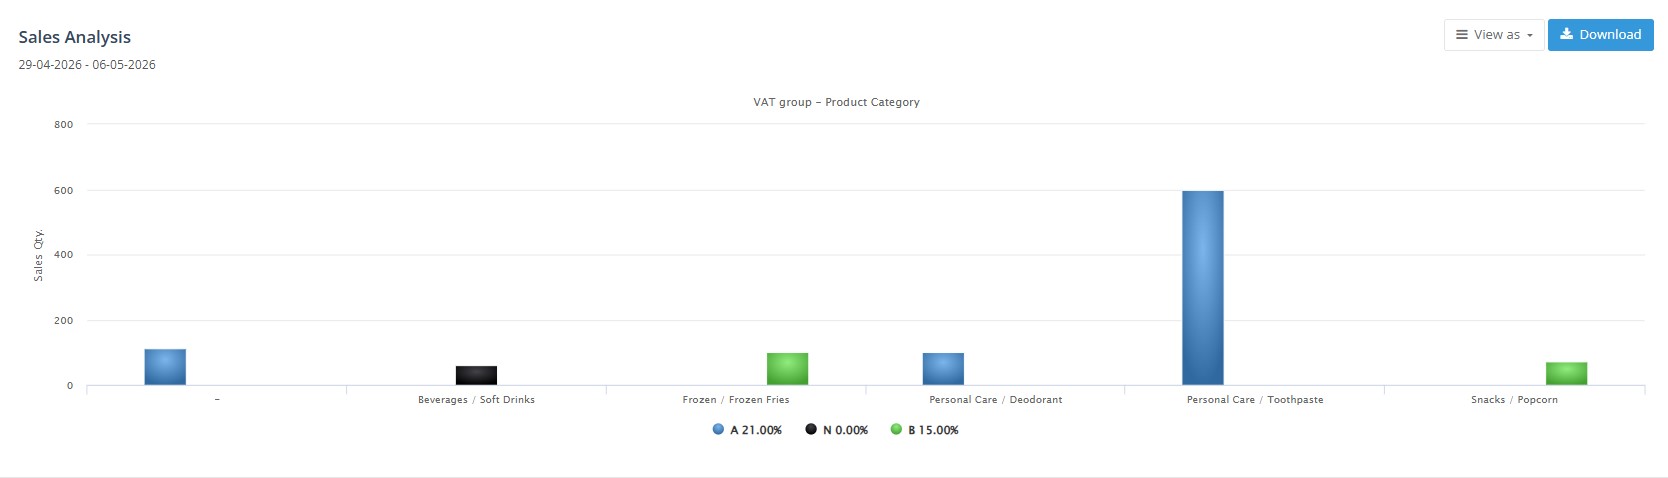
- Below the reminders, one or more sales analysis reports are displayed. Each report appears as a table by default (for example, Sales incl. VAT per Date) for a specific date range.
- You can change the presentation of a report using the View as drop‑down: choose between Table, Graph or Pie chart. When viewing as a graph or pie chart, the chart updates based on the selected report and period.
- Use the three comparison buttons – L4L (Like‑for‑like), Previous Period and Previous Complete Period – to change how KPIs are compared. The i icon explains that L4L stands for “Like for like”.
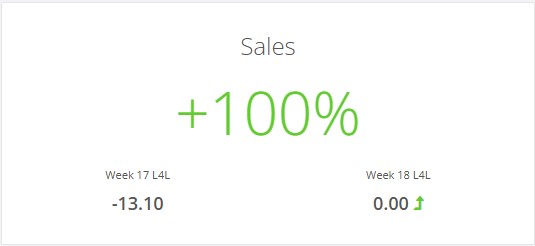
- Under the report(s) are KPI tiles summarising metrics such as Gross Margin %, Sales, Average Basket, Sales per m², Sales quantity and Customer count.
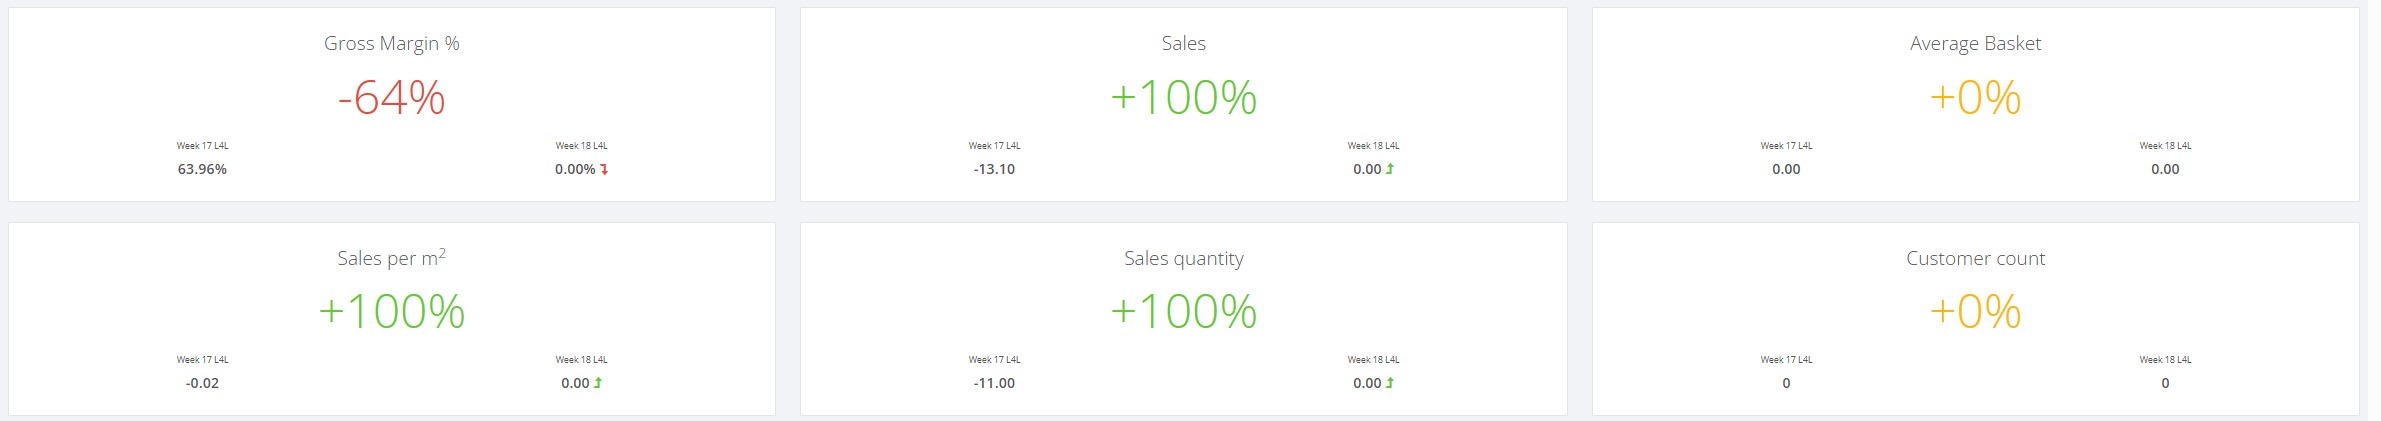 Each tile compares the current period against a previous period (displayed beneath the tile). These tiles update automatically when you change the compare type or selected locations.
- Below the reminders, one or more sales analysis reports are displayed. Each report appears as a table by default (for example, Sales incl. VAT per Date) for a specific date range.
- Checking setup and licence status:
- If your organisation has not completed essential setup steps, a checklist appears at the top of the home page. The checklist includes items such as Client profile created, Units of measure created, VAT groups created, Products added, Vendors added and Locations added. When all tasks are completed, the checklist hides automatically, but you can also hide it manually using the provided option.

- If licence management is enabled, banners appear listing any expired licences, licences that are about to expire and locations without licences. Contact support if you see a licence warning.
- If your organisation has not completed essential setup steps, a checklist appears at the top of the home page. The checklist includes items such as Client profile created, Units of measure created, VAT groups created, Products added, Vendors added and Locations added. When all tasks are completed, the checklist hides automatically, but you can also hide it manually using the provided option.
- Customising KPI tiles and reports:
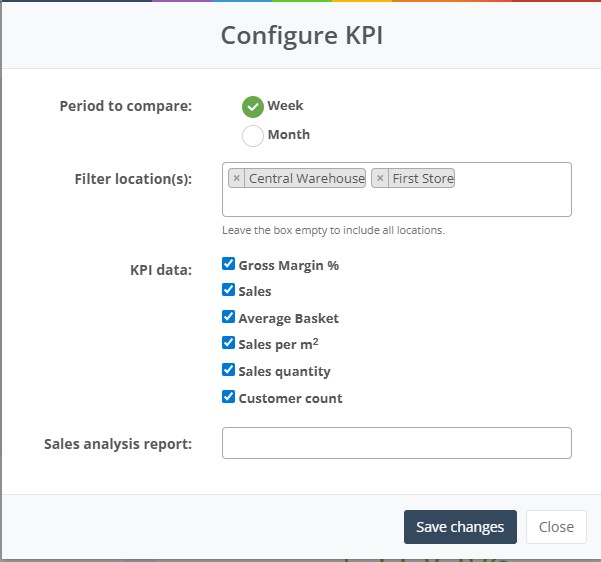
- Click the green Configure KPI button. A dialog opens where you can configure your dashboard:
- In the Period to compare section, choose between Week and Month to define the comparison period.
- In Location(s), select one or more locations to filter KPI data and reports. Leave the field empty to include all locations.
- Under KPI data, tick the checkboxes for each KPI you want to display. At least one KPI must be selected; otherwise the dashboard will not show any tiles.
- In Sales analysis report(s), choose one or more reports from the list. The system supports multiple selections; each selected report appears in its own table or chart on the home page. If you remove all reports, no report section will be displayed.
- Click Save changes to apply your selections. The system remembers your configuration, so you see the same dashboard each time you log in.
- Creating reminders via CRM:
- Navigate to Customers or Vendors, open a record and select the CRM tab.
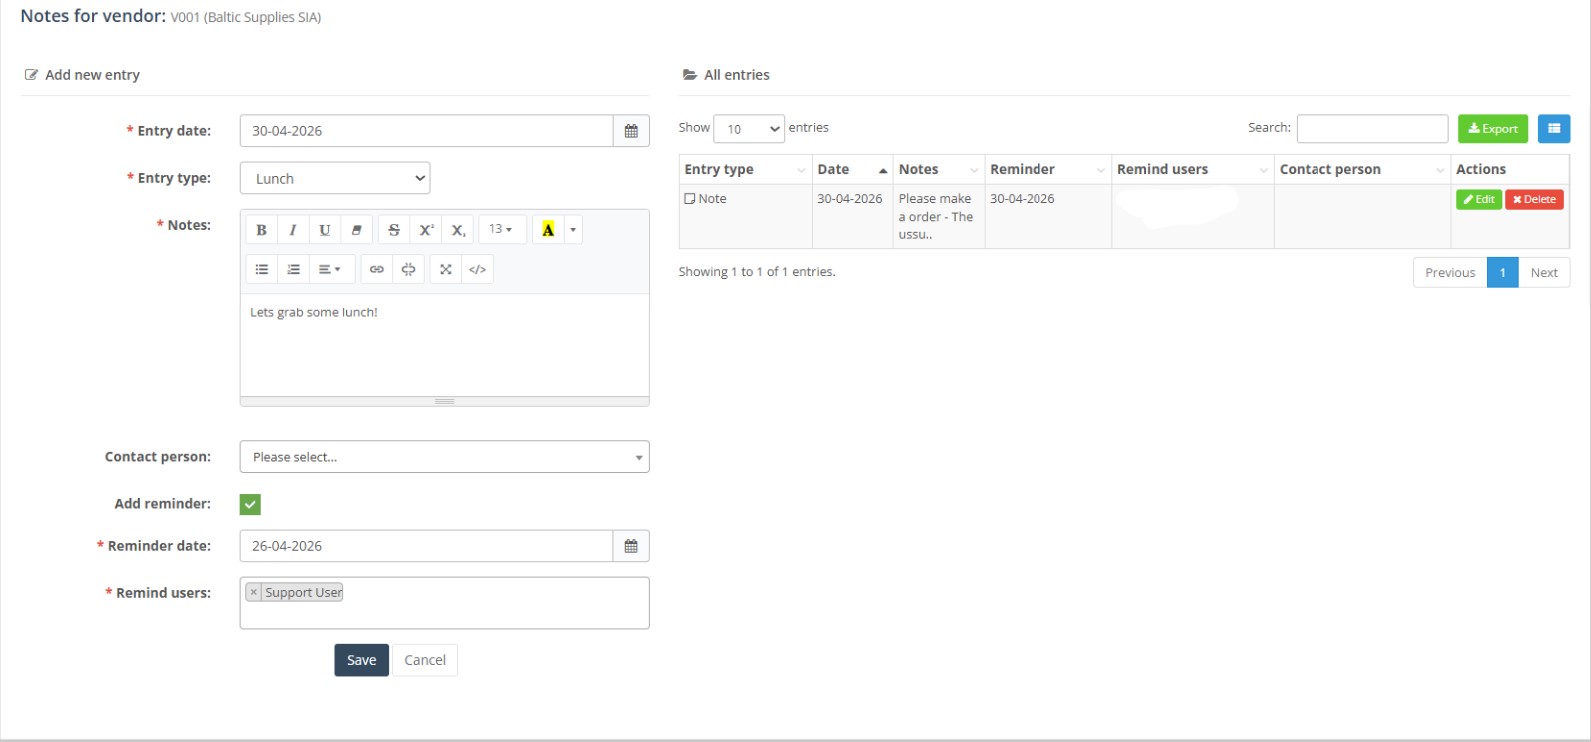
- Add a new entry by choosing an Entry date, selecting an Entry type (e.g., Phone, Meeting) and entering Notes.
- Select a Contact person if applicable and tick the Add reminder checkbox to set a reminder. After saving, the reminder appears on the home page for the specified remind users.
- Existing reminders can be edited, and their Remind users column determines who will see them.
- Create a new report in Reports → Sales Analysis. You can define the dimensions (columns and rows), amounts to show and the period.
- Ensure you have the view Sales Analysis Report right to access it.
- In the home page’s Configure KPI dialog, select one or more reports from the Sales analysis report(s) list. Once saved, your selected reports appear on the home page as tables or charts.
Required Fields
The home page itself has no direct input fields, but certain actions require mandatory information:
- CRM entry: You must provide an Entry date, Entry type and Notes when creating a CRM entry. To set a reminder, select a Reminder date and specify at least one Remind user.
- KPI configuration: In the Configure KPI dialog you must choose a Period to compare (Week or Month) and select at least one KPI tile. Selecting a location is optional. At least one sales analysis report must be chosen if you want to display reports.
Validation Rules
- A CRM entry cannot be saved without an Entry date, Entry type and Notes. Reminder entries must include a reminder date and at least one remind user.
- In the KPI configuration, at least one KPI tile and at least one report must be selected. Attempting to save with all KPI tiles deselected or no reports chosen will result in an error and the changes will not be saved.
- The period to compare must be either Week or Month; other values are not accepted.
- The dashboard displays only those sales analysis reports to which the user has access. If you select a report and later lose permission, it will not be shown.
- The system retains your KPI and report selections per user; they do not affect other users.
Common Errors
- No KPIs shown: occurs when the user lacks the Home → KPI right or has deselected all KPI tiles in the configuration. Edit the configuration to include at least one KPI and ensure you have the necessary rights.
- “Access denied” on report: indicates that the user doesn’t have permission to view the selected sales analysis report. Select a report you are authorised to view or request access.
- Reminder not visible: the reminder may not be assigned to the current user, or it may have been closed. Check the CRM tab for the customer or vendor and verify the Remind users settings.
- Checklist not showing: occurs when all setup items (client profile, unit of measure, VAT group, product, vendor and location) have been completed or the checklist has been hidden. You can no longer view it unless an item is deleted.
- Licence warning: If you see warnings about expired or soon‑to‑expire licences, contact support. These warnings appear only when licence management is enabled.
Troubleshooting
- If KPI values show 0, verify that sales data exists for the selected period and locations. Try expanding the period or choosing a different location.
- Use the comparison buttons to adjust the baseline period: L4L compares to the same period last year; Previous Period compares to the immediately preceding period; Previous Complete Period compares to the previous full week or month.
- If reminders are not appearing, ensure the reminder date has arrived and that you are listed as a remind user. Closed reminders no longer appear on the home page.
- If the checklist continues to display even after completing the listed tasks, you may have hidden only one or two items; open each related module (client profile, units of measure, VAT groups, products, vendors and locations) and ensure at least one record exists. After all items are complete, the checklist hides.
- When using multiple reports, if one report fails to load or says “Report not found,” it may have been deleted or renamed. Edit your KPI configuration and select an existing report.
Video Material
Related Pages
- Administration Users – manage user permissions to control who can view KPIs and reports.
- Product List – view and manage all products.
- Product Card – edit individual product details.
- Reports Overview – explore various reports available in Resico ERP.
- Sales Analysis Reports – create and configure sales analysis reports for use on the home page.
- Client Profile – update client details used in the checklist.